General Information
- Respond to a bar chart, pie chart, line graph, table, map or flowchart
- Write at least 150 words
- Select and report on the main features
- For charts/graphs/tables, describe the data and compare it, reporting any significant results or trends that you notice
- For flowcharts, describe the process of how the thing works/is done
- Spend no more than 20 minutes on this task
Structure of the Essay
Paragraph 1: Opening (approximately 40-60 words)
Describe what the graph/chart/flowchart is showing or describing without copying the wording in the question.
Paragraph 2: Main Body (approximately 100-120 words)
Highlight the key information. Support points with examples or numbers from the data. There is no need to speculate or provide your own opinion on the data.
Paragraph 3: Conclusion (approximately 30-50 words)
Summarise the most important points from the data.
Sample Question: Bar Charts
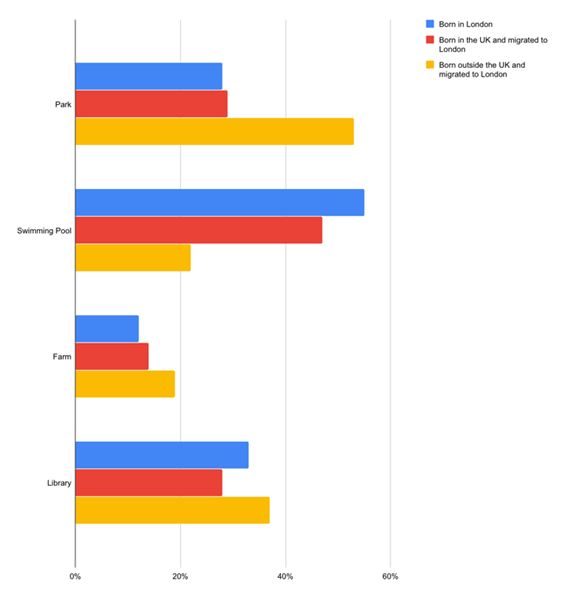
This chart shows the places visited by people living in London.
Summarise the information by deciding on and exploring its main features, and make any relevant comparison.

Model Answer: Bar Charts
This chart shows information about the types of leisure activities three distinct groups of people living in London engage in the most frequently.
The three groups represented in this chart are people born in London, people who migrated to London from another part of the UK where they were born, and those who were born abroad and migrated to London.
Visiting the park is by far the most popular activity for those born outside of the UK. Over 50% of this group visit the park in their free time, in comparison to less than 30% of those born in the UK. For those who are UK-born, the swimming pool is clearly a preferential activity.
The swimming pool is frequently visited by approximately 50% of people from these two groups. Interestingly, the farm is an unpopular choice for all three groups represented by only 10-20% of any group visiting this location.
A slightly higher percentage of all three categories visit the local library, including nearly two-fifths of all those living in London who were born abroad.
Overall, it is clear that learning to swim is seen as a necessity by those born in the UK. On the other hand, for those born abroad, free leisure activities tend to be the most appealing.
Key Words and Phrases
- This chart shows information about…
- popular/unpopular
- the most / the least popular
- higher / lower percentage
- over ___% / under ___% / only ___% / around ___%
- increased / decreased
- by approximately ____%
- less than / more than
- in comparison to
- preferential / preferred / more desired
- less preferential / less desired
- Interestingly…
- Overall, it is clear that…
- On the other hand…
- In addition…
Practice Test: Bar Chart
The bar chart below shows the most common sports played in London in 2014.
Summarise the information by deciding on and exploring its main features, and make any relevant comparison.

Practice Test: Sample Answer
This chart shows information about the types of sports two distinct groups of people living in London played in 2014. The two groups represented in this chart are people who reside in London but were born abroad and people living in London who were born in the United Kingdom.
Playing football is by far the most popular activity for London residents who are UK-born. Over 60% of this group play football, in comparison to less than 40% of those born outside the UK.
For those who moved to London from abroad, cricket is clearly a preferential activity. It is played by almost 60% of the people in this group. Interestingly, netball is a less popular choice for both groups, with only around 20% of each group playing this sport.
A slightly higher percentage of those born outside the UK played netball, just over 20%, whereas this was a particularly unpopular sport for those born in the UK, with only 10% engaging in this sporting activity.
Overall, it is clear that the most popular sports for those born in the UK are different from those born outside of the UK. On the other hand, the two groups show a similar distaste for netball, which is a more unpopular choice for both.

