General Information
- Respond to a bar chart, pie chart, line graph, table, map or flowchart
- Write at least 150 words
- Select and report on the main features
- For charts/graphs/tables, describe the data and compare it, reporting any significant results or trends that you notice
- For flowcharts, describe the process of how the thing works/is done
- Spend no more than 20 minutes on this task
Structure of the Essay
Paragraph 1: Opening (approximately 40-60 words)
Describe what the graph/chart/flowchart is showing or describing without copying the wording in the question.
Paragraph 2: Main Body (approximately 100-170 words)
Highlight the key information. Support points with examples or numbers from the data. There is no need to speculate or provide your own opinion on the data.
Paragraph 3: Conclusion (approximately 30-50 words)
Summarise the most important points from the data.
Sample Question: Line Graphs
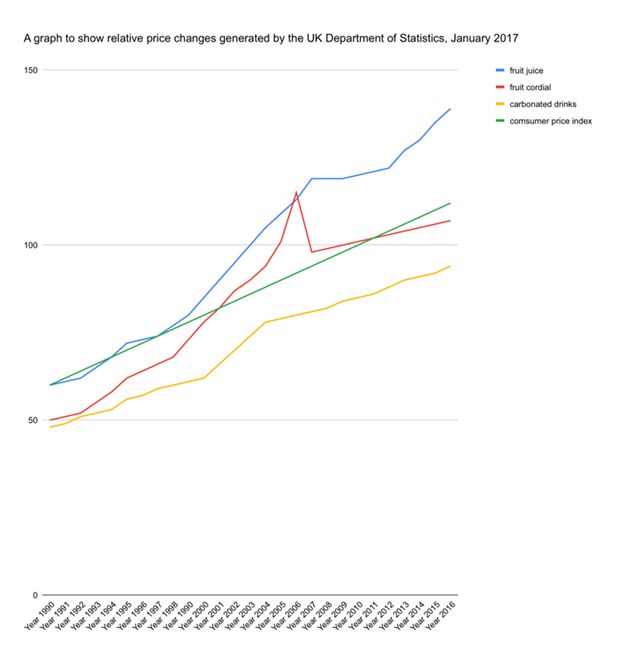
The line graph below shows the relative price changes for fruit juice, fruit cordial, and carbonated drinks between 1990 and 2016.
Summarise the information by deciding on and exploring its main features, and make any relevant comparison.

Model Answer: Line Graphs
This graph shows increases and decreases in the price of fruit juice, fruit cordial, and carbonated drinks in the UK for over 26 years between 1990 and 2016. The graph also shows the consumer price index to show the fluctuation of costs during this time.
While the consumer price index shows a steady rise over the time period, the same cannot be said for the price of any of the drinks represented on the graph.
The cost of fruit juice appears to have increased at a much higher rate than the other drink products and the consumer price index, despite some fluctuations, noticeably the slower increase in price from 2007 to 2012.
The price of fruit cordial initially rose at a similar rate to that of fruit juice, although at a lower cost. A sharp rise in the cost of cordial in 2006 put it at a higher price than fruit juice for the first time, before a dramatic decline brought its price down in 2007. Its price by 2016 sat below that of the consumer price index.
Carbonated drinks, on the other hand, have remained at a much lower price than the consumer price index and the cost of the other beverages throughout the whole 26 year period. Despite some more dramatic price inflation in the early 2000s, its price has been consistently low.
Overall, it is clear that fruit juice has been an expensive choice for consumers since the 1990s, whereas carbonated drink products offer a cheaper alternative to shoppers on a budget.
Key Words and Phrases
- This graph shows…
- increase / decrease / reduction
- sharp rise / incline / increase / decline / decrease / reduction
- dramatic rise / incline / increase / decline / decrease / reduction
- steady rise / incline / increase / decline / decrease / reduction
- faster/ slower than
- higher / lower than
- significant / insignificant
- similar / same / different rate than…
- on the other hand
- consistently / inconsistently
- in contrast
- Overall it is clear that…
- whereas/ in contrast to / while
Practice Test: Line Graph
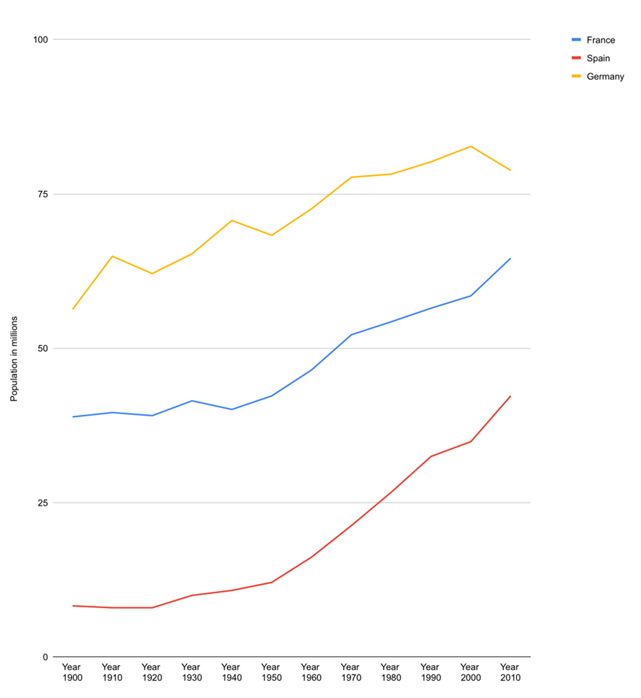
The line graph below shows population figures for France, Germany, and Spain since the year 1900.
Summarise the information by deciding on and exploring its main features, and make any relevant comparison.

Practice Test: Sample Answer
This graph shows increases and decreases in the population of three European countries, France, Germany, and Spain, in ten-year intervals between 1900 and 2010.
The graph clearly shows that Germany has the largest population, followed by France and then Spain. At its peak, the population of Germany reached approximately 80 million, whilst the peak for France sits around 63 million, and Spain tops out at about 40 million. Germany experienced its most significant growth between 1900 and 1910 and 1930 to 1940.
The population of all three countries has grown throughout the 110 years. The population of France shows the most steady rise, despite on sharp increase between 1920 and 1930 followed by a sharp decline. France also saw a dramatic increase between 2000 and 2010, a sudden surge in population that was also seen in the Spanish population.
The population of Spain was slow to grow from 1900 to 1950. Since the 1950s, its population has shown significant incline decade upon decade. The sharpest increase in population from 1900 to 2010 has been seen in Spain, with the population rising from a mere 10 million to approximately 40 million.
Overall, it is clear that Germany has maintained the largest population of the course of time between 1900 and 2010. However, the Spanish population is rising at a fast rate and could take over from France and Germany in the years to come.

