 General Information
- Respond to a bar chart, pie chart, line graph, table, map or flowchart
- Write at least 150 words
- Select and report on the main features
- For charts/graphs/tables, describe the data and compare it, reporting any significant results or trends that you notice
- For flowcharts, describe the process of how the thing works/is done
- Spend no more than 20 minutes on this task
Structure of the Essay
Paragraph 1: Opening (approximately 40-60 words)
Describe what the graph/chart/flowchart is showing or describing without copying the wording in the question.
Paragraph 2: Main Body (approximately 100-130 words)
Highlight the key information. Support points with examples or numbers from the data. There is no need to speculate or provide your own opinion on the data.
Paragraph 3: Conclusion (approximately 30-50 words)
Summarise the most important points from the data.
Sample Question: Pie Charts
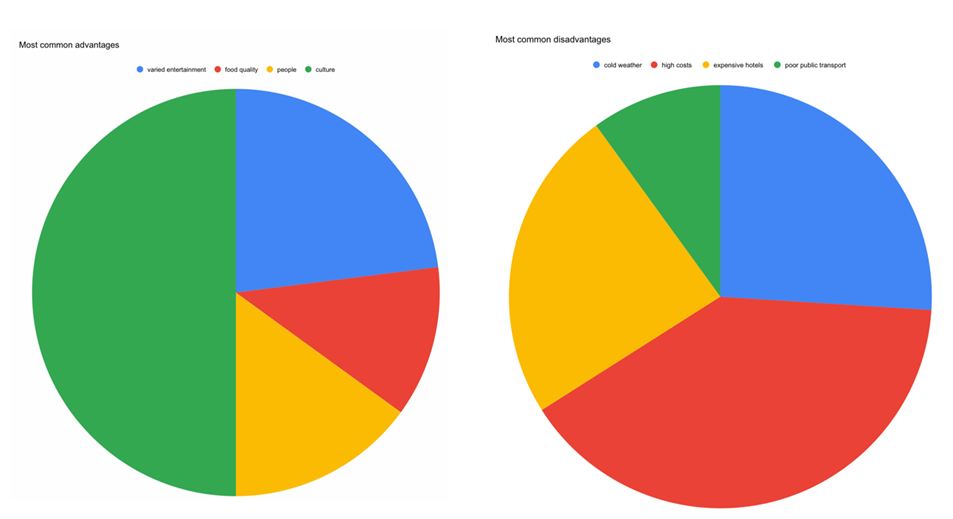
The pie charts below show the most common advantages and disadvantages of visiting London, according to a survey of recent visitors.
Summarise the information by deciding on and exploring its main features, and make any relevant comparison.

Model Answer: Pie Charts
These two pie charts show information regarding the aspects of London that visiting tourists most like and dislike. The advantages include the range of entertainment and cultural options available, the quality of the food and friendliness of the people. In contrast, poor weather, the high costs in London and poor public transport are listed amongst the key disadvantages.
It appears that 50% of visitors are attracted to and impressed by the culture of London. This compares to just 12% of people who visit the capital for its high quality of food. Almost a quarter of all visitors see the range of entertainment options as one of London’s greatest advantages, whilst a small number are attracted to London for the friendliness of its people.
On the other hand, cold weather is a key disadvantage for approximately a quarter of all visitors. A similar number of visitors seemed put off by the high cost of hotels. Surprisingly, a much small number of visitors identified poor public transport as the main disadvantage, with the clear majority identifying high costs incurred as London’s most unimpressive feature.
Overall, it appears that most visitors to London enjoy the vast range of cultural activities available. However, its historical value may play a role in the heightened prices in the city, making it a pricey destination for visitors.
Key Words and Phrases
- These two pie charts chart shows information regarding…
- most like/ most dislike
- It appears that…
- almost ___% / almost a quarter / almost a half
- just under ___% / just under a quarter / just under a half
- over ___% / over a quarter / over a half
- This compares to…
- greatest advantage / greatest disadvantage
- small percentage / small fraction / large percentage / large fraction
- On the other hand…
- …make up ___% of the total
- the other ___%
- Surprisingly…
- Interestingly…
- Overall, it is clear that…
- Overall, it appears that…
- However…
Practice Test: Pie Chart
These charts show the results of a survey about what children and adults say makes them most happy.
Summarise the information by deciding on and exploring its main features, and make any relevant comparison.

Practice Test: Sample Answer
These two pie charts show information regarding things that make adults and children happy. Two groups, one formed of children and the other form of adults, were asked whether eating sweets, being with friends, watching TV and movies or participating in their favourite hobbies made them most happy.
It appears that just under 50% of adults are made happiest by their hobbies. This compares to around just 15% of children. Over a quarter of adults feel happiness when spending time with their friends.
A smaller percentage of children selected being with friends as their top activity for happiness, although this was still chosen by around 25% of the whole group. The activity that made the least number of adults the happiest was eating sweets.
Unsurprisingly, this was the most popular answer for children with over a third of children claiming the eating of sweets made them happiest. One similarity between the two sets of data is for watching TV and movies.
A small number of both adults and children selected this activity represented by similar-sized pieces on the chart.
Overall, it appears that there are some vast differences between what makes children and adults happy. While being with friends is of moderate importance to both groups, adults would prioritise engaging in their hobbies for happiness, whilst children would prioritise a sugar rush.
